HSLS:09 Study Replication Example 3 (Shi, Q., 2018)

ED230A
Author

Shuhan (Alice) Ai

Published

November 28, 2025

1. Study Introduction

Shi, Q. (2018). Immigrant versus Nonimmigrant 9th Graders’ Use of School Counseling Services. Journal of School Counseling, 16(20). https://files.eric.ed.gov/fulltext/EJ1191016.pdf.

Abstract: This research investigated 9th-grade immigrant and nonimmigrant student use of school counseling services using the High School Longitudinal Study 2009 (HSLS:09). This study highlighted profiles of both immigrant and nonimmigrant 9th graders who see school counselors for various services and examined the impact of a series of variables (demographic, support services received, school belonging, and school engagement) on the use of school counseling services. Lastly, this research compared immigrant students with nonimmigrant students in their use of school counseling services. Implications for school counseling practice and future research are discussed.

Research questions:

  • RQ1: What school counseling services do immigrant 9th graders use?

  • RQ2: What are the profiles of immigrant 9th graders who see school counselors for various services?

  • RQ3: What is the impact of a series of variables (demographic, support services received, school belongingness, and school engagement) on immigrant 9th graders’ use of school counseling services?

  • RQ4: What are the significant differences between immigrant and nonimmigrant 9th graders in their use of school counseling services and the predictors of their use?

Sample and Method:

Using: Public-used HSLS.

The participants in this study include both 9th grade immigrant students and nonimmigrant students in the HSLS:09 data. Immigrant students have to meet the following criteria: (a) participated in the base year of HSLS:09; (b) were born outside of the U.S. Nonimmigrant students were those who: (a) participated in the base year of HSLS:09; (b) were born in the U.S. or U.S. territories.

  • Immigrant students: n = 1,239
  • Nonimmigrant students: n = 1,459 (randomly selected 10% of original 14,560), our replication only have 1474 obs

Variable Lists:

Demographic Variables:

  • P1USBORN9: (P1 B17 Whether student was born in the U.S.) immigrant and nonimmigrant 9th graders;
  • X1SEX: gender (1 = male; 2 = female);
  • X1SES: SES (continuous composite variable that was calculated using parents’ education, occupation, and family income);
  • X1RACE: race/ethnicity (1 = White, 2 = Asian, 3 = Black, 4 = Hispanic, 5 = mixed);
  • S1LANG1ST: first language learned to speak (1 = English only, 2 = non-English language, 3 = English and non-English equally);
  • P1USYR9: year student came to the U.S. to stay (recoded into “length staying in the U.S.”) - immigrant only;
  • P1USGRADE: grade level 9th graders were placed in when started school in the U.S - immigrant only.

ELL and Special Education Service Variables:

  • P1ELLNOW: (a) 9th grader’s current ELL status;

  • P1SPECIALED: (b) whether 9th grader is currently receiving special education services.

  • X1SCHOOLBEL: School Belonging (scale variable);

School Counseling Services Variables six binary (1 = yes and 0 = no):

  • S1CNSLTALKM: (a) 9th grader talked to school counselor about 2009-2010 math courses;
  • S1CNSLTALKS: (b) 9th grader talked to school counselor about 2009-2010 science courses;
  • S1CNSLTLKOTH: (c) 9th grader talked to school counselor about 2009-2010 other courses;
  • S1CNSLTLKCLG: (d) 9th grader talked to school counselor about going to college;
  • S1CNSLTLKJOB: (e) 9th grader talked to school counselor about adult jobs/careers;
  • S1CNSLTLKPRB: (f) 9th grader talked to school counselor about personal problems.
  • (use (a)-(c) create a binary var represents “school counseling service about coursework”)

2. Set up packages and data

  • p.24 “Third, this study used listwise deletion method to handle missing data. Listwise deletion removes an entire record for a participant if any single value is missing for that person (Honaker & King, 2010).”
  • the paper claimed use likewise deletion here, however, in the data replication process, I only found that the removed to NA values in the immigrant status.
rm(list=ls())

library(tidyverse)
library(broom)
library(lm.beta)
library(ppcor)
library(table1)

load("/Users/aishuhan/Desktop/UCLA PhD/Dataset/HSLS 2009-2013 Public Use Data ICPSR_36423/DS0002 Student Level Data/36423-0002-Data.rda")

dt <- da36423.0002
remove(da36423.0002)

data <- dt %>%
  dplyr::select(P1USBORN9, X1SEX, X1SES, X1RACE, X1ASIAN, X1WHITE, 
                S1LANG1ST, P1USYR9, P1USGRADE, P1ELLEVER, P1ELLNOW, P1SPECIALED, 
                X1SCHOOLBEL, S1CNSLTALKM, S1CNSLTALKS, S1CNSLTLKOTH, S1CNSLTLKCLG, S1CNSLTLKJOB, S1CNSLTLKPRB)


#P1USYR9; P1USGRADE; P1ELLNOW has missing rate of 0.946
colMeans(is.na(data))
   P1USBORN9        X1SEX        X1SES       X1RACE      X1ASIAN      X1WHITE 
0.3199166064 0.0002552866 0.0876058376 0.0428030464 1.0000000000 0.0240394843 
   S1LANG1ST      P1USYR9    P1USGRADE    P1ELLEVER     P1ELLNOW  P1SPECIALED 
0.0886695315 0.9463047271 0.9460494405 0.3295749479 0.9456665107 0.3369357103 
 X1SCHOOLBEL  S1CNSLTALKM  S1CNSLTALKS S1CNSLTLKOTH S1CNSLTLKCLG S1CNSLTLKJOB 
0.1201123261 0.1067523295 0.1197719440 0.1150916904 0.1108369144 0.1104114368 
S1CNSLTLKPRB 
0.1115176786 
table(data$P1USBORN9)

                        (1) United States 
                                    14683 
(2) Puerto Rico or another U.S. territory 
                                       62 
                      (3) Another country 
                                     1239 
table(data$S1LANG1ST)

                             (1) English 
                                   17863 
                             (2) Spanish 
                                    1180 
                    (3) Another language 
                                    1021 
         (4) English and Spanish equally 
                                     659 
(5) English and another language equally 
                                     696 
table(data$X1RACE)

      (0) No bio/adoptive/step-parent in household 
                                                 0 
      (1) Amer. Indian/Alaska Native, non-Hispanic 
                                               165 
                           (2) Asian, non-Hispanic 
                                              1952 
          (3) Black/African-American, non-Hispanic 
                                              2450 
                   (4) Hispanic, no race specified 
                                               422 
                      (5) Hispanic, race specified 
                                              3375 
              (6) More than one race, non-Hispanic 
                                              1941 
(7) Native Hawaiian/Pacific Islander, non-Hispanic 
                                               110 
                           (8) White, non-Hispanic 
                                             12082 
table(data$S1CNSLTALKM)

 (0) No (1) Yes 
  16655    4339 
summary(data$P1USYR9)
   Min. 1st Qu.  Median    Mean 3rd Qu.    Max.    NA's 
   1994    1997    2000    2001    2004    2009   22241 
str(data)
'data.frame':   23503 obs. of  19 variables:
 $ P1USBORN9   : Factor w/ 3 levels "(1) United States",..: 1 1 1 1 1 1 1 1 1 1 ...
 $ X1SEX       : Factor w/ 2 levels "(1) Male","(2) Female": 1 2 2 2 1 2 2 1 1 2 ...
 $ X1SES       : num  1.56 -0.37 1.27 0.55 0.15 ...
  ..- attr(*, "value.labels")= Named num(0) 
  .. ..- attr(*, "names")= chr(0) 
 $ X1RACE      : Factor w/ 9 levels "(0) No bio/adoptive/step-parent in household",..: 9 9 4 9 9 9 9 9 9 9 ...
 $ X1ASIAN     : num  NA NA NA NA NA NA NA NA NA NA ...
  ..- attr(*, "value.labels")= Named num(0) 
  .. ..- attr(*, "names")= chr(0) 
 $ X1WHITE     : Factor w/ 2 levels "(0) Student is not White",..: 2 2 1 2 2 2 2 2 2 2 ...
 $ S1LANG1ST   : Factor w/ 5 levels "(1) English",..: 1 1 1 1 1 1 1 1 1 4 ...
 $ P1USYR9     : num  NA NA NA NA NA NA NA NA NA NA ...
  ..- attr(*, "value.labels")= Named num(0) 
  .. ..- attr(*, "names")= chr(0) 
 $ P1USGRADE   : Factor w/ 11 levels "(01) Pre-kindergarten",..: NA NA NA NA NA NA NA NA NA NA ...
 $ P1ELLEVER   : Factor w/ 3 levels "(1) Yes","(2) No",..: 2 2 2 2 2 2 2 2 2 2 ...
 $ P1ELLNOW    : Factor w/ 3 levels "(1) Yes","(2) No",..: NA NA NA NA NA NA NA NA NA NA ...
 $ P1SPECIALED : Factor w/ 3 levels "(1) Yes","(2) No",..: 2 2 2 2 2 2 3 2 2 2 ...
 $ X1SCHOOLBEL : num  0.84 0.05 0.37 -0.04 -2.27 -0.52 1.23 0.45 0.11 -0.29 ...
  ..- attr(*, "value.labels")= Named num(0) 
  .. ..- attr(*, "names")= chr(0) 
 $ S1CNSLTALKM : Factor w/ 2 levels "(0) No","(1) Yes": 1 2 2 2 1 1 1 1 2 1 ...
 $ S1CNSLTALKS : Factor w/ 2 levels "(0) No","(1) Yes": 1 2 1 2 1 1 1 1 1 1 ...
 $ S1CNSLTLKOTH: Factor w/ 2 levels "(0) No","(1) Yes": 1 2 1 2 1 1 1 1 2 1 ...
 $ S1CNSLTLKCLG: Factor w/ 2 levels "(0) No","(1) Yes": 1 2 1 1 1 1 1 1 2 1 ...
 $ S1CNSLTLKJOB: Factor w/ 2 levels "(0) No","(1) Yes": 1 2 1 1 1 1 1 1 1 2 ...
 $ S1CNSLTLKPRB: Factor w/ 2 levels "(0) No","(1) Yes": 1 1 1 1 1 1 1 1 1 1 ...
 - attr(*, "variable.labels")= Named chr [1:6608] "Case Identification Number" "Student ID" "School ID" "X1 School identification number from CCD or PSS" ...
  ..- attr(*, "names")= chr [1:6608] "CASEID" "STU_ID" "SCH_ID" "X1NCESID" ...
 - attr(*, "codepage")= int 28591
data <- data %>%
  dplyr::mutate(
  
    immigrant = case_when(
      P1USBORN9 %in% c("(1) United States", "(2) Puerto Rico or another U.S. territory") ~ "Nonimmigrant",
      P1USBORN9 == "(3) Another country" ~ "Immigrant",
      TRUE ~ NA_character_
    ),
    
    ethnicity = case_when(
      X1RACE == "(8) White, non-Hispanic" ~ "White",
      X1RACE == "(2) Asian, non-Hispanic" ~ "Asian",
      X1RACE == "(3) Black/African-American, non-Hispanic" ~ "Black",
      X1RACE %in% c("(4) Hispanic, no race specified", "(5) Hispanic, race specified") ~ "Hispanic",
      X1RACE == "(6) More than one race, non-Hispanic" ~ "Mixed",
      X1RACE == "(1) Amer. Indian/Alaska Native, non-Hispanic" ~ "American Indian",
      X1RACE == "(7) Native Hawaiian/Pacific Islander, non-Hispanic" ~ "Native Hawaiian",
      TRUE ~ NA_character_
    ),

    first_lang = case_when(
      S1LANG1ST == "(1) English" ~ "English only",
      S1LANG1ST %in% c("(2) Spanish", "(3) Another language") ~ "Non-English",
      S1LANG1ST %in% c("(4) English and Spanish equally", "(5) English and another language equally") ~ "Both equally",
      TRUE ~ NA_character_
    ),
    
    years_us = case_when(
      immigrant == "Immigrant" & P1USYR9 > 0 & P1USYR9 <= 2009 ~ 2009 - as.numeric(P1USYR9),
       TRUE ~ NA_real_),
    
     talk_courses = case_when(
      S1CNSLTALKM == "(1) Yes" | S1CNSLTALKS == "(1) Yes" | S1CNSLTLKOTH == "(1) Yes" ~ "(1) Yes",
      S1CNSLTALKM == "(0) No" & S1CNSLTALKS == "(0) No" & S1CNSLTLKOTH == "(0) No" ~ "(0) No",
      TRUE ~ NA_character_
        )) %>%
    filter(!is.na(immigrant)) 


imm_data <- data %>% filter(immigrant == "Immigrant")
set.seed(42)
non_data <- data %>% filter(immigrant == "Nonimmigrant") %>% slice_sample(prop = 0.1)

3. Descriptive Analysis Table 1 and Table 2

table1(~ factor(X1SEX) + factor(ethnicity) + factor(first_lang) + factor(P1ELLEVER) + factor(P1ELLNOW) + factor(P1SPECIALED) + years_us + P1USGRADE, data = imm_data)
Overall
(N=1239)
factor(X1SEX)
(1) Male 598 (48.3%)
(2) Female 641 (51.7%)
factor(ethnicity)
American Indian 6 (0.5%)
Asian 474 (38.3%)
Black 74 (6.0%)
Hispanic 452 (36.5%)
Mixed 62 (5.0%)
Native Hawaiian 21 (1.7%)
White 150 (12.1%)
factor(first_lang)
Both equally 151 (12.2%)
English only 267 (21.5%)
Non-English 769 (62.1%)
Missing 52 (4.2%)
factor(P1ELLEVER)
(1) Yes 526 (42.5%)
(2) No 644 (52.0%)
(3) Don't know 45 (3.6%)
Missing 24 (1.9%)
factor(P1ELLNOW)
(1) Yes 147 (11.9%)
(2) No 364 (29.4%)
(3) Don't know 15 (1.2%)
Missing 713 (57.5%)
factor(P1SPECIALED)
(1) Yes 59 (4.8%)
(2) No 1109 (89.5%)
(3) Don't know 29 (2.3%)
Missing 42 (3.4%)
years_us
Mean (SD) 8.18 (4.36)
Median [Min, Max] 9.00 [0, 15.0]
Missing 38 (3.1%)
P1USGRADE
(01) Pre-kindergarten 288 (23.2%)
(02) Kindergarten 297 (24.0%)
(03) 1st grade 104 (8.4%)
(04) 2nd grade 68 (5.5%)
(05) 3rd grade 66 (5.3%)
(06) 4th grade 76 (6.1%)
(07) 5th grade 62 (5.0%)
(08) 6th grade 66 (5.3%)
(09) 7th grade 67 (5.4%)
(10) 8th grade 48 (3.9%)
(11) 9th grade 64 (5.2%)
Missing 33 (2.7%)
table1(~ factor(X1SEX) + factor(ethnicity) + factor(first_lang) + factor(P1ELLEVER) + factor(P1ELLNOW) + factor(P1SPECIALED) + years_us + P1USGRADE, data = non_data)
Overall
(N=1474)
factor(X1SEX)
(1) Male 777 (52.7%)
(2) Female 697 (47.3%)
factor(ethnicity)
American Indian 10 (0.7%)
Asian 74 (5.0%)
Black 152 (10.3%)
Hispanic 234 (15.9%)
Mixed 137 (9.3%)
Native Hawaiian 12 (0.8%)
White 855 (58.0%)
factor(first_lang)
Both equally 96 (6.5%)
English only 1271 (86.2%)
Non-English 79 (5.4%)
Missing 28 (1.9%)
factor(P1ELLEVER)
(1) Yes 73 (5.0%)
(2) No 1368 (92.8%)
(3) Don't know 18 (1.2%)
Missing 15 (1.0%)
factor(P1ELLNOW)
(1) Yes 25 (1.7%)
(2) No 42 (2.8%)
(3) Don't know 6 (0.4%)
Missing 1401 (95.0%)
factor(P1SPECIALED)
(1) Yes 106 (7.2%)
(2) No 1316 (89.3%)
(3) Don't know 20 (1.4%)
Missing 32 (2.2%)
years_us
Mean (SD) NA (NA)
Median [Min, Max] NA [NA, NA]
Missing 1474 (100%)
P1USGRADE
(01) Pre-kindergarten 2 (0.1%)
(02) Kindergarten 1 (0.1%)
(03) 1st grade 0 (0%)
(04) 2nd grade 0 (0%)
(05) 3rd grade 0 (0%)
(06) 4th grade 1 (0.1%)
(07) 5th grade 0 (0%)
(08) 6th grade 0 (0%)
(09) 7th grade 0 (0%)
(10) 8th grade 2 (0.1%)
(11) 9th grade 0 (0%)
Missing 1468 (99.6%)
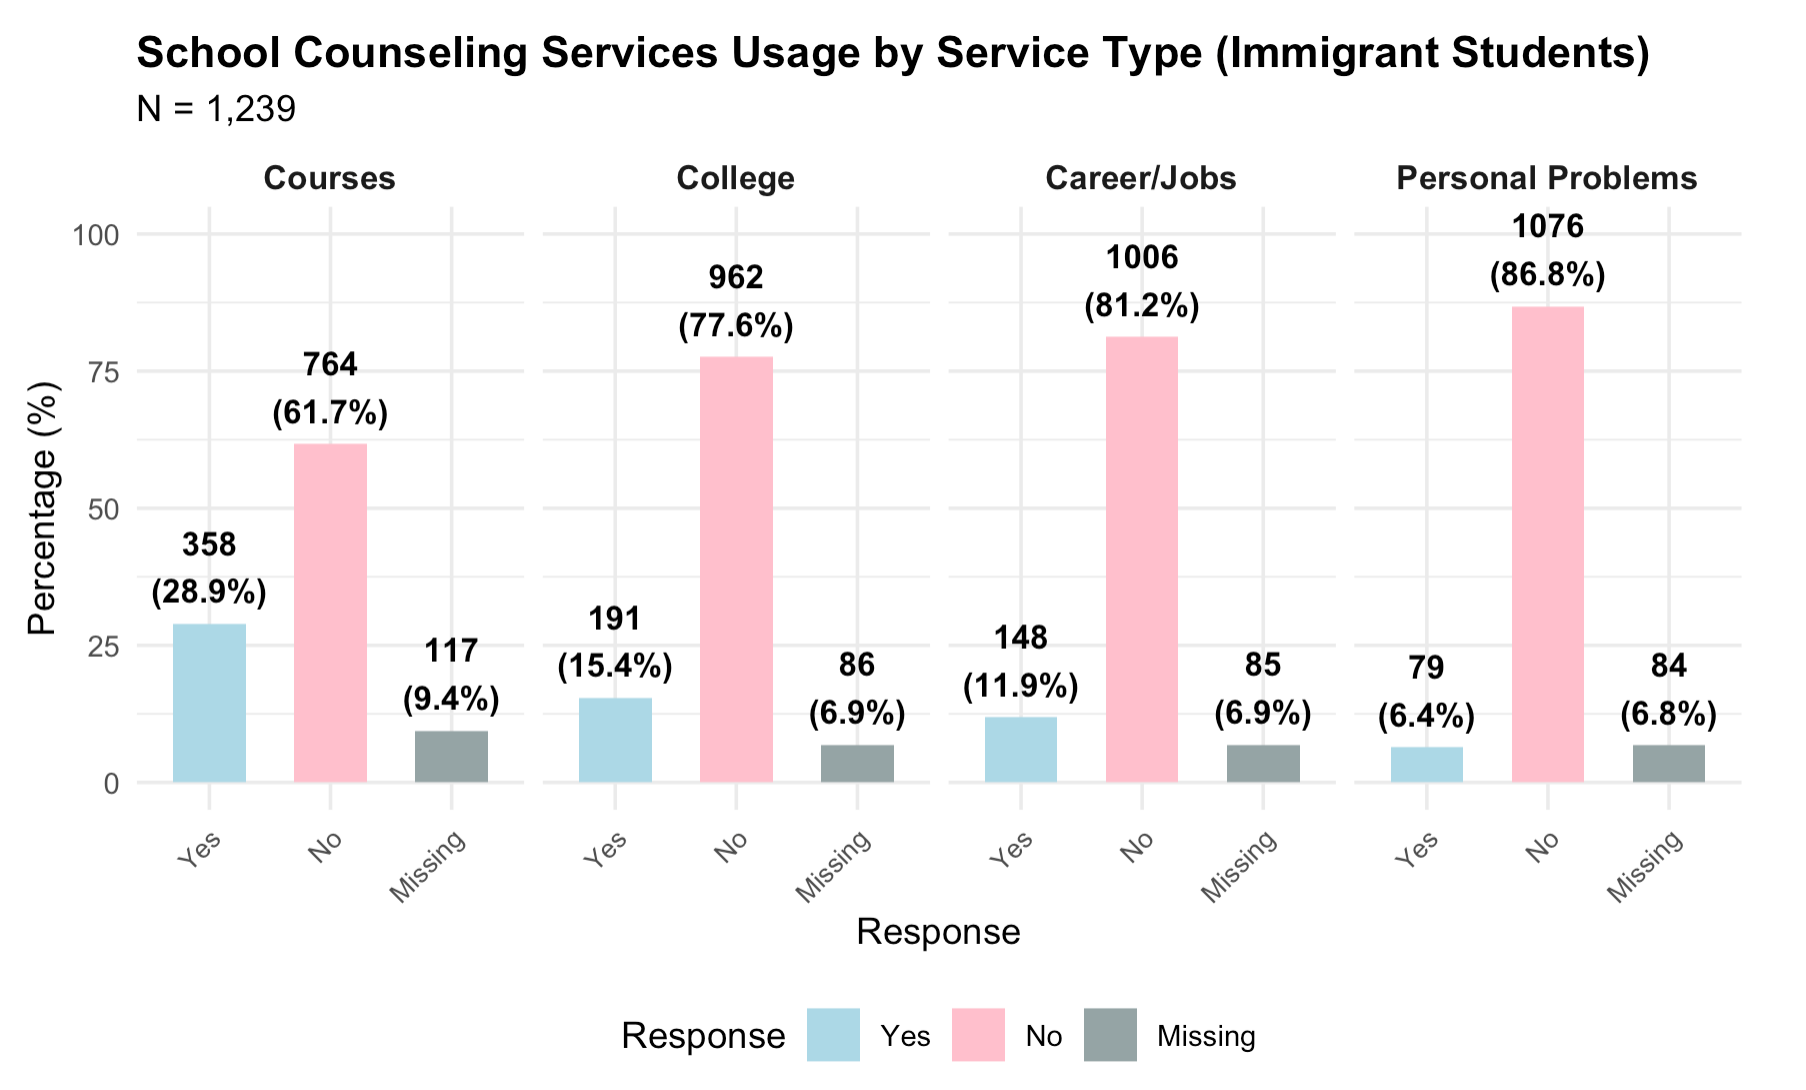
table1(~ factor(talk_courses) + factor(S1CNSLTLKCLG) + factor(S1CNSLTLKJOB) + factor(S1CNSLTLKPRB), data = imm_data)
Overall
(N=1239)
factor(talk_courses)
(0) No 764 (61.7%)
(1) Yes 358 (28.9%)
Missing 117 (9.4%)
factor(S1CNSLTLKCLG)
(0) No 962 (77.6%)
(1) Yes 191 (15.4%)
Missing 86 (6.9%)
factor(S1CNSLTLKJOB)
(0) No 1006 (81.2%)
(1) Yes 148 (11.9%)
Missing 85 (6.9%)
factor(S1CNSLTLKPRB)
(0) No 1076 (86.8%)
(1) Yes 79 (6.4%)
Missing 84 (6.8%)
table1(~ factor(talk_courses) + factor(S1CNSLTLKCLG) + factor(S1CNSLTLKJOB) + factor(S1CNSLTLKPRB), data = non_data)
Overall
(N=1474)
factor(talk_courses)
(0) No 990 (67.2%)
(1) Yes 405 (27.5%)
Missing 79 (5.4%)
factor(S1CNSLTLKCLG)
(0) No 1153 (78.2%)
(1) Yes 260 (17.6%)
Missing 61 (4.1%)
factor(S1CNSLTLKJOB)
(0) No 1198 (81.3%)
(1) Yes 221 (15.0%)
Missing 55 (3.7%)
factor(S1CNSLTLKPRB)
(0) No 1308 (88.7%)
(1) Yes 111 (7.5%)
Missing 55 (3.7%)

4. Chi-square Test

  • without any cross-tabulation
#Chi-square: Gender * Talk about courses
table1(~ imm_data$talk_course | X1SEX, data = imm_data)
(1) Male
(N=598)
(2) Female
(N=641)
Overall
(N=1239)
imm_data$talk_course
(0) No 382 (63.9%) 382 (59.6%) 764 (61.7%)
(1) Yes 154 (25.8%) 204 (31.8%) 358 (28.9%)
Missing 62 (10.4%) 55 (8.6%) 117 (9.4%)
gender_courses <- table(imm_data$X1SEX, imm_data$talk_course)
chisq.test(gender_courses)

    Pearson's Chi-squared test with Yates' continuity correction

data:  gender_courses
X-squared = 4.4888, df = 1, p-value = 0.03412
#Chi-square: Race/ethnicity * Talk about courses (across race group)
table1(~ imm_data$talk_course | ethnicity, data = imm_data)
American Indian
(N=6)
Asian
(N=474)
Black
(N=74)
Hispanic
(N=452)
Mixed
(N=62)
Native Hawaiian
(N=21)
White
(N=150)
Overall
(N=1239)
imm_data$talk_course
(0) No 5 (83.3%) 279 (58.9%) 50 (67.6%) 287 (63.5%) 39 (62.9%) 18 (85.7%) 86 (57.3%) 764 (61.7%)
(1) Yes 1 (16.7%) 165 (34.8%) 15 (20.3%) 107 (23.7%) 21 (33.9%) 2 (9.5%) 47 (31.3%) 358 (28.9%)
Missing 0 (0%) 30 (6.3%) 9 (12.2%) 58 (12.8%) 2 (3.2%) 1 (4.8%) 17 (11.3%) 117 (9.4%)
eth_courses <- table(imm_data$ethnicity, imm_data$talk_courses)
chisq.test(eth_courses)

    Pearson's Chi-squared test

data:  eth_courses
X-squared = 18.112, df = 6, p-value = 0.005959
#Chi-square: Race/ethnicity * Talk about courses (white-only group)
white_only <- imm_data %>% filter(ethnicity == "White")
eth_coursesw <- table(white_only$ethnicity, white_only$talk_courses)
chisq.test(eth_coursesw)

    Chi-squared test for given probabilities

data:  eth_coursesw
X-squared = 11.436, df = 1, p-value = 0.0007203
#Chi-square: Race/ethnicity * Talk about personal problem
table1(~ S1CNSLTLKPRB | ethnicity, data = imm_data)
American Indian
(N=6)
Asian
(N=474)
Black
(N=74)
Hispanic
(N=452)
Mixed
(N=62)
Native Hawaiian
(N=21)
White
(N=150)
Overall
(N=1239)
S1CNSLTLKPRB
(0) No 5 (83.3%) 432 (91.1%) 67 (90.5%) 378 (83.6%) 52 (83.9%) 18 (85.7%) 124 (82.7%) 1076 (86.8%)
(1) Yes 0 (0%) 22 (4.6%) 0 (0%) 34 (7.5%) 8 (12.9%) 2 (9.5%) 13 (8.7%) 79 (6.4%)
Missing 1 (16.7%) 20 (4.2%) 7 (9.5%) 40 (8.8%) 2 (3.2%) 1 (4.8%) 13 (8.7%) 84 (6.8%)
eth_personal<- table(imm_data$ethnicity, imm_data$S1CNSLTLKPRB)
chisq.test(eth_personal)

    Pearson's Chi-squared test

data:  eth_personal
X-squared = 15.202, df = 6, p-value = 0.01874
#Chi-square: ELL status * Talk about personal problems
table1(~ S1CNSLTLKPRB | P1ELLNOW, data = imm_data %>% filter(P1ELLNOW == "(1) Yes"))
(1) Yes
(N=147)
Overall
(N=147)
S1CNSLTLKPRB
(0) No 108 (73.5%) 108 (73.5%)
(1) Yes 12 (8.2%) 12 (8.2%)
Missing 27 (18.4%) 27 (18.4%)
eth_ellpers <- table(imm_data$P1ELLNOW, imm_data$S1CNSLTLKPRB)
chisq.test(eth_ellpers)

    Pearson's Chi-squared test

data:  eth_ellpers
X-squared = 0.87132, df = 2, p-value = 0.6468

3. Logistic Regressions

Immigrant Student Population

  • Concerns: the original paper used categorical variables as numeric variables.
  • The ELL status is not clear whether its means current status (P1ELLNOW), or also include the previous status (P1ELLEVER).
  • Couldn’t replicate their study results, I assume because the model default for the likewise deletion (806 observations deleted due to missingness). If so, the final analysis sample for the m1 is 433.
#Model 1 Talk with school counselor about courses
imm_data <- imm_data %>% mutate(talk_courses_bin = ifelse(talk_courses == "(1) Yes", 1, 0),
                               talk_college_bin = ifelse(S1CNSLTLKCLG == "(1) Yes", 1, 0),
                               talk_job_bin = ifelse(S1CNSLTLKJOB == "(1) Yes", 1, 0),
                               talk_personal_bin = ifelse(S1CNSLTLKPRB == "(1) Yes", 1, 0),
                                ell_bin = ifelse(P1ELLNOW == "(1) Yes", 1, 0),
                                specied_bin = ifelse(P1SPECIALED  == "(1) Yes", 1, 0))


m1 <- glm(talk_courses_bin ~ X1SES + X1SEX + ethnicity + first_lang + years_us + 
            P1USGRADE + ell_bin + specied_bin + X1SCHOOLBEL, data = imm_data, family = binomial(link = "logit"))
summary(m1)

Call:
glm(formula = talk_courses_bin ~ X1SES + X1SEX + ethnicity + 
    first_lang + years_us + P1USGRADE + ell_bin + specied_bin + 
    X1SCHOOLBEL, family = binomial(link = "logit"), data = imm_data)

Coefficients:
                            Estimate Std. Error z value Pr(>|z|)  
(Intercept)                -0.238516   1.728506  -0.138   0.8902  
X1SES                       0.160720   0.131908   1.218   0.2231  
X1SEX(2) Female            -0.073567   0.224863  -0.327   0.7435  
ethnicityAsian             -0.270460   1.475867  -0.183   0.8546  
ethnicityBlack             -0.627088   1.543060  -0.406   0.6845  
ethnicityHispanic          -0.180891   1.480043  -0.122   0.9027  
ethnicityMixed             -0.416649   1.549367  -0.269   0.7880  
ethnicityNative Hawaiian   -1.480934   1.880938  -0.787   0.4311  
ethnicityWhite             -0.277970   1.504962  -0.185   0.8535  
first_langEnglish only      0.256778   0.557165   0.461   0.6449  
first_langNon-English       0.147829   0.398784   0.371   0.7109  
years_us                    0.007336   0.067672   0.108   0.9137  
P1USGRADE(02) Kindergarten -0.752944   0.396235  -1.900   0.0574 .
P1USGRADE(03) 1st grade    -0.533230   0.485717  -1.098   0.2723  
P1USGRADE(04) 2nd grade    -0.615656   0.575406  -1.070   0.2846  
P1USGRADE(05) 3rd grade    -0.452881   0.614368  -0.737   0.4610  
P1USGRADE(06) 4th grade     0.116741   0.633649   0.184   0.8538  
P1USGRADE(07) 5th grade    -0.201530   0.698324  -0.289   0.7729  
P1USGRADE(08) 6th grade    -0.890900   0.794803  -1.121   0.2623  
P1USGRADE(09) 7th grade     0.502926   0.801849   0.627   0.5305  
P1USGRADE(10) 8th grade    -0.334370   0.911866  -0.367   0.7139  
P1USGRADE(11) 9th grade     1.367120   0.980979   1.394   0.1634  
ell_bin                    -0.764653   0.323192  -2.366   0.0180 *
specied_bin                -0.912050   0.651664  -1.400   0.1616  
X1SCHOOLBEL                 0.087729   0.123240   0.712   0.4766  
---
Signif. codes:  0 '***' 0.001 '**' 0.01 '*' 0.05 '.' 0.1 ' ' 1

(Dispersion parameter for binomial family taken to be 1)

    Null deviance: 532.52  on 432  degrees of freedom
Residual deviance: 498.11  on 408  degrees of freedom
  (806 observations deleted due to missingness)
AIC: 548.11

Number of Fisher Scoring iterations: 4
exp(coef(m1))     
               (Intercept)                      X1SES 
                 0.7877958                  1.1743560 
           X1SEX(2) Female             ethnicityAsian 
                 0.9290738                  0.7630285 
            ethnicityBlack          ethnicityHispanic 
                 0.5341450                  0.8345266 
            ethnicityMixed   ethnicityNative Hawaiian 
                 0.6592522                  0.2274253 
            ethnicityWhite     first_langEnglish only 
                 0.7573194                  1.2927580 
     first_langNon-English                   years_us 
                 1.1593151                  1.0073631 
P1USGRADE(02) Kindergarten    P1USGRADE(03) 1st grade 
                 0.4709779                  0.5867071 
   P1USGRADE(04) 2nd grade    P1USGRADE(05) 3rd grade 
                 0.5402861                  0.6357940 
   P1USGRADE(06) 4th grade    P1USGRADE(07) 5th grade 
                 1.1238278                  0.8174787 
   P1USGRADE(08) 6th grade    P1USGRADE(09) 7th grade 
                 0.4102864                  1.6535521 
   P1USGRADE(10) 8th grade    P1USGRADE(11) 9th grade 
                 0.7157887                  3.9240313 
                   ell_bin                specied_bin 
                 0.4654953                  0.4017000 
               X1SCHOOLBEL 
                 1.0916927 
m2 <- glm(talk_college_bin ~ X1SES + X1SEX + ethnicity + first_lang + years_us + 
            P1USGRADE + ell_bin + specied_bin + X1SCHOOLBEL, data = imm_data, family = binomial(link = "logit"))
summary(m2)

Call:
glm(formula = talk_college_bin ~ X1SES + X1SEX + ethnicity + 
    first_lang + years_us + P1USGRADE + ell_bin + specied_bin + 
    X1SCHOOLBEL, family = binomial(link = "logit"), data = imm_data)

Coefficients:
                            Estimate Std. Error z value Pr(>|z|)   
(Intercept)                -16.13296  617.59454  -0.026  0.97916   
X1SES                       -0.08118    0.15924  -0.510  0.61018   
X1SEX(2) Female              0.03193    0.26923   0.119  0.90559   
ethnicityAsian              14.27150  617.59372   0.023  0.98156   
ethnicityBlack              13.28281  617.59411   0.022  0.98284   
ethnicityHispanic           14.33977  617.59373   0.023  0.98148   
ethnicityMixed              14.49332  617.59390   0.023  0.98128   
ethnicityNative Hawaiian    13.90789  617.59467   0.023  0.98203   
ethnicityWhite              13.04588  617.59398   0.021  0.98315   
first_langEnglish only       0.37549    0.64468   0.582  0.56027   
first_langNon-English       -0.03211    0.45576  -0.070  0.94383   
years_us                     0.05997    0.07072   0.848  0.39645   
P1USGRADE(02) Kindergarten  -0.65148    0.46423  -1.403  0.16052   
P1USGRADE(03) 1st grade     -0.56648    0.59811  -0.947  0.34358   
P1USGRADE(04) 2nd grade     -0.81922    0.75096  -1.091  0.27532   
P1USGRADE(05) 3rd grade     -0.15914    0.70093  -0.227  0.82039   
P1USGRADE(06) 4th grade      0.26975    0.70071   0.385  0.70026   
P1USGRADE(07) 5th grade      0.71133    0.76828   0.926  0.35452   
P1USGRADE(08) 6th grade      0.62790    0.81191   0.773  0.43931   
P1USGRADE(09) 7th grade      0.92413    0.86830   1.064  0.28719   
P1USGRADE(10) 8th grade     -1.19353    1.27889  -0.933  0.35069   
P1USGRADE(11) 9th grade      0.23357    1.07283   0.218  0.82765   
ell_bin                     -0.48282    0.34469  -1.401  0.16129   
specied_bin                 -0.01614    0.68152  -0.024  0.98111   
X1SCHOOLBEL                  0.39700    0.15072   2.634  0.00844 **
---
Signif. codes:  0 '***' 0.001 '**' 0.01 '*' 0.05 '.' 0.1 ' ' 1

(Dispersion parameter for binomial family taken to be 1)

    Null deviance: 409.23  on 442  degrees of freedom
Residual deviance: 378.16  on 418  degrees of freedom
  (796 observations deleted due to missingness)
AIC: 428.16

Number of Fisher Scoring iterations: 13
exp(coef(m2))     
               (Intercept)                      X1SES 
              9.852463e-08               9.220265e-01 
           X1SEX(2) Female             ethnicityAsian 
              1.032446e+00               1.577726e+06 
            ethnicityBlack          ethnicityHispanic 
              5.870179e+05               1.689204e+06 
            ethnicityMixed   ethnicityNative Hawaiian 
              1.969553e+06               1.096783e+06 
            ethnicityWhite     first_langEnglish only 
              4.631848e+05               1.455706e+00 
     first_langNon-English                   years_us 
              9.684013e-01               1.061800e+00 
P1USGRADE(02) Kindergarten    P1USGRADE(03) 1st grade 
              5.212753e-01               5.675200e-01 
   P1USGRADE(04) 2nd grade    P1USGRADE(05) 3rd grade 
              4.407746e-01               8.528766e-01 
   P1USGRADE(06) 4th grade    P1USGRADE(07) 5th grade 
              1.309642e+00               2.036689e+00 
   P1USGRADE(08) 6th grade    P1USGRADE(09) 7th grade 
              1.873665e+00               2.519678e+00 
   P1USGRADE(10) 8th grade    P1USGRADE(11) 9th grade 
              3.031500e-01               1.263105e+00 
                   ell_bin                specied_bin 
              6.170406e-01               9.839916e-01 
               X1SCHOOLBEL 
              1.487360e+00 
m3 <- glm(talk_job_bin ~ X1SES + X1SEX + ethnicity + first_lang + years_us + 
            P1USGRADE + ell_bin + specied_bin + X1SCHOOLBEL, data = imm_data, family = binomial(link = "logit"))
summary(m3)

Call:
glm(formula = talk_job_bin ~ X1SES + X1SEX + ethnicity + first_lang + 
    years_us + P1USGRADE + ell_bin + specied_bin + X1SCHOOLBEL, 
    family = binomial(link = "logit"), data = imm_data)

Coefficients:
                             Estimate Std. Error z value Pr(>|z|)   
(Intercept)                 -20.41939 2793.48079  -0.007  0.99417   
X1SES                         0.38152    0.17316   2.203  0.02758 * 
X1SEX(2) Female               0.39521    0.30163   1.310  0.19011   
ethnicityAsian               16.10331 2793.48057   0.006  0.99540   
ethnicityBlack               15.72978 2793.48066   0.006  0.99551   
ethnicityHispanic            16.57594 2793.48057   0.006  0.99527   
ethnicityMixed               16.08599 2793.48065   0.006  0.99541   
ethnicityNative Hawaiian     17.54156 2793.48070   0.006  0.99499   
ethnicityWhite               16.51979 2793.48059   0.006  0.99528   
first_langEnglish only       -0.10216    0.80166  -0.127  0.89859   
first_langNon-English        -0.03744    0.50937  -0.073  0.94141   
years_us                      0.14079    0.07941   1.773  0.07623 . 
P1USGRADE(02) Kindergarten    0.20056    0.59064   0.340  0.73419   
P1USGRADE(03) 1st grade       0.25059    0.75691   0.331  0.74059   
P1USGRADE(04) 2nd grade       0.77414    0.78518   0.986  0.32416   
P1USGRADE(05) 3rd grade       1.49199    0.77791   1.918  0.05512 . 
P1USGRADE(06) 4th grade       1.81772    0.82782   2.196  0.02811 * 
P1USGRADE(07) 5th grade       2.45081    0.89253   2.746  0.00603 **
P1USGRADE(08) 6th grade       2.19239    0.95010   2.308  0.02102 * 
P1USGRADE(09) 7th grade       2.19083    1.04163   2.103  0.03544 * 
P1USGRADE(10) 8th grade     -13.96034  796.40798  -0.018  0.98601   
P1USGRADE(11) 9th grade       0.75972    1.41430   0.537  0.59115   
ell_bin                      -0.09668    0.38534  -0.251  0.80190   
specied_bin                   0.29714    0.63650   0.467  0.64062   
X1SCHOOLBEL                   0.23580    0.16448   1.434  0.15168   
---
Signif. codes:  0 '***' 0.001 '**' 0.01 '*' 0.05 '.' 0.1 ' ' 1

(Dispersion parameter for binomial family taken to be 1)

    Null deviance: 354.18  on 439  degrees of freedom
Residual deviance: 317.70  on 415  degrees of freedom
  (799 observations deleted due to missingness)
AIC: 367.7

Number of Fisher Scoring iterations: 16
exp(coef(m3))     
               (Intercept)                      X1SES 
              1.355102e-09               1.464504e+00 
           X1SEX(2) Female             ethnicityAsian 
              1.484703e+00               9.853271e+06 
            ethnicityBlack          ethnicityHispanic 
              6.782003e+06               1.580657e+07 
            ethnicityMixed   ethnicityNative Hawaiian 
              9.684025e+06               4.151462e+07 
            ethnicityWhite     first_langEnglish only 
              1.494354e+07               9.028814e-01 
     first_langNon-English                   years_us 
              9.632562e-01               1.151180e+00 
P1USGRADE(02) Kindergarten    P1USGRADE(03) 1st grade 
              1.222081e+00               1.284782e+00 
   P1USGRADE(04) 2nd grade    P1USGRADE(05) 3rd grade 
              2.168728e+00               4.445921e+00 
   P1USGRADE(06) 4th grade    P1USGRADE(07) 5th grade 
              6.157787e+00               1.159776e+01 
   P1USGRADE(08) 6th grade    P1USGRADE(09) 7th grade 
              8.956591e+00               8.942601e+00 
   P1USGRADE(10) 8th grade    P1USGRADE(11) 9th grade 
              8.651702e-07               2.137688e+00 
                   ell_bin                specied_bin 
              9.078509e-01               1.345998e+00 
               X1SCHOOLBEL 
              1.265922e+00 
m4 <- glm(specied_bin ~ X1SES + X1SEX + ethnicity + first_lang + years_us + 
            P1USGRADE + ell_bin + specied_bin + X1SCHOOLBEL, data = imm_data, family = binomial(link = "logit"))
summary(m4)

Call:
glm(formula = specied_bin ~ X1SES + X1SEX + ethnicity + first_lang + 
    years_us + P1USGRADE + ell_bin + specied_bin + X1SCHOOLBEL, 
    family = binomial(link = "logit"), data = imm_data)

Coefficients:
                             Estimate Std. Error z value Pr(>|z|)
(Intercept)                -2.112e+01  1.244e+04  -0.002    0.999
X1SES                       1.998e-01  2.761e-01   0.724    0.469
X1SEX(2) Female            -1.567e-01  4.641e-01  -0.338    0.736
ethnicityAsian              1.774e+01  1.244e+04   0.001    0.999
ethnicityBlack              5.155e-01  1.286e+04   0.000    1.000
ethnicityHispanic           1.777e+01  1.244e+04   0.001    0.999
ethnicityMixed              2.077e-02  1.305e+04   0.000    1.000
ethnicityNative Hawaiian    2.109e+01  1.244e+04   0.002    0.999
ethnicityWhite              1.830e+01  1.244e+04   0.001    0.999
first_langEnglish only      2.038e+00  1.557e+00   1.309    0.191
first_langNon-English       2.025e+00  1.421e+00   1.426    0.154
years_us                   -1.214e-01  1.459e-01  -0.832    0.405
P1USGRADE(02) Kindergarten -4.642e-02  7.836e-01  -0.059    0.953
P1USGRADE(03) 1st grade    -7.103e-01  1.040e+00  -0.683    0.495
P1USGRADE(04) 2nd grade    -1.087e+00  1.335e+00  -0.814    0.416
P1USGRADE(05) 3rd grade     4.111e-01  1.109e+00   0.371    0.711
P1USGRADE(06) 4th grade    -1.885e+01  2.660e+03  -0.007    0.994
P1USGRADE(07) 5th grade    -9.392e-01  1.463e+00  -0.642    0.521
P1USGRADE(08) 6th grade    -1.889e+01  2.906e+03  -0.006    0.995
P1USGRADE(09) 7th grade    -1.965e+01  2.844e+03  -0.007    0.994
P1USGRADE(10) 8th grade    -6.054e-01  1.747e+00  -0.346    0.729
P1USGRADE(11) 9th grade    -1.995e+01  3.581e+03  -0.006    0.996
ell_bin                     6.488e-01  6.175e-01   1.051    0.293
X1SCHOOLBEL                 4.937e-02  2.520e-01   0.196    0.845

(Dispersion parameter for binomial family taken to be 1)

    Null deviance: 181.70  on 450  degrees of freedom
Residual deviance: 144.43  on 427  degrees of freedom
  (788 observations deleted due to missingness)
AIC: 192.43

Number of Fisher Scoring iterations: 19
exp(coef(m4))     
               (Intercept)                      X1SES 
              6.722532e-10               1.221134e+00 
           X1SEX(2) Female             ethnicityAsian 
              8.549495e-01               5.077461e+07 
            ethnicityBlack          ethnicityHispanic 
              1.674451e+00               5.208273e+07 
            ethnicityMixed   ethnicityNative Hawaiian 
              1.020992e+00               1.436239e+09 
            ethnicityWhite     first_langEnglish only 
              8.869780e+07               7.677484e+00 
     first_langNon-English                   years_us 
              7.578579e+00               8.856793e-01 
P1USGRADE(02) Kindergarten    P1USGRADE(03) 1st grade 
              9.546444e-01               4.915162e-01 
   P1USGRADE(04) 2nd grade    P1USGRADE(05) 3rd grade 
              3.371478e-01               1.508504e+00 
   P1USGRADE(06) 4th grade    P1USGRADE(07) 5th grade 
              6.498087e-09               3.909309e-01 
   P1USGRADE(08) 6th grade    P1USGRADE(09) 7th grade 
              6.249686e-09               2.916796e-09 
   P1USGRADE(10) 8th grade    P1USGRADE(11) 9th grade 
              5.458853e-01               2.170925e-09 
                   ell_bin                X1SCHOOLBEL 
              1.913140e+00               1.050611e+00 

4. Brief Methodoligical Comments on Shi,Q.(2018)

1. Missing Data Handling

The paper states on page 24 that “this study used listwise deletion method to handle missing data. Listwise deletion removes an entire record for a participant if any single value is missing for that person (Honaker & King, 2010).” However, during the replication process, I found that missing data handling was inconsistent and not clearly documented:

  • The explicit missing data removal appears to be filtering out cases with missing immigrant status (!is.na(immigrant)), so we can have a imm_data sample size of 1,239.
  • The paper does not report how many cases were excluded due to missing data at each analysis stage.
  • For the logistic regression models, R’s glm() function automatically applies listwise deletion when encountering missing values, which results in substantial sample size reduction. For example, in Model 1 (immigrant students, courses outcome), approximately 806 observations were deleted due to missingness, reducing the analysis sample from 1,239 to approximately 433 cases.This 65% reduction in sample size is never mentioned in the paper, raising concerns about: whether the regression results are representative of the full immigrant sample and the actual statistical power of the analyses. This may be the reason why the results cannot be replicated.

2. Chi-Square Test Presentation and Interpretation

Lack of Cross-Tabulation

The paper reports chi-square test results without presenting the cross-tabulations, making it difficult to interpret the direction and magnitude of associations. Presenting frequency tables alongside chi-square statistics would be helpful.

Ambiguous Comparison Groups

The chi-square interpretation is confusing and potentially misleading. For example, on page 14, the paper states: “White and Asian students were more likely to talk to school counselors about courses, X²(1) = 13.80, p < .01.”

  • With the df = 1, it appears to be a within race (such as white) comparison. If this is a pairwise comparison, which groups are being compared? White vs. non-White? Asian vs. non-Asian? White+Asian vs. others?

Replication: In my replication, I conducted both

  • Omnibus chi-square tests (e.g., Ethnicity * Talk about courses with df = 6) to test overall associations
  • Pairwise comparisons when specific group (limited to White only) differences

Authors should explicitly state their comparison strategy (e.g., “White students were more likely to talk to counselors about courses compared to all non-White groups …”). Post-hoc comparisons following significant omnibus tests should be clearly labeled and appropriately adjusted for multiple comparisons.

3. Logistic Regression

The original paper appears to have treated categorical variables (ethnicity, first language, gender) as numeric variables in the logistic regression models. This may lead to invalid statistical inferences and misleading interpreations.

Moreover, as noted in the above missingness concerns, the regression models suffer from substantial missing data. For the immigrant student models:

  • Starting sample: 1,239 immigrant students
  • Analysis sample (Model 1): ~ 433 students (65% reduction)
  • The paper never reports this reduction
  • The experimental results cannot be reproduced